Network Domain
As of March 2024, our team of researchers in UIC’s Networks and Governance Lab have identified over 65 community health and wellness collaborative groups in the City of Chicago and Cook County, involving over 800 public and private sector organizations. In the Chicago metro area reveals there is a complex and dynamic environment where diverse organizations operate with varied motivations and resources, collectively contributing to the region’s public health and wellness landscape landscape.
Bridging Organizations
In our research, we have found that within network domain, or larger community network of PONs, there are many organizations that belong to more than one PON. These organizations serve in bridging roles that connect PONs and support the sharing of ideas and resources across the domain. Of these bridging organizations, 2% are PONs themselves, 4% are for-profit, 20% are government agencies, and an incredible 74% are nonprofit organizations.

Core-periphery Structure
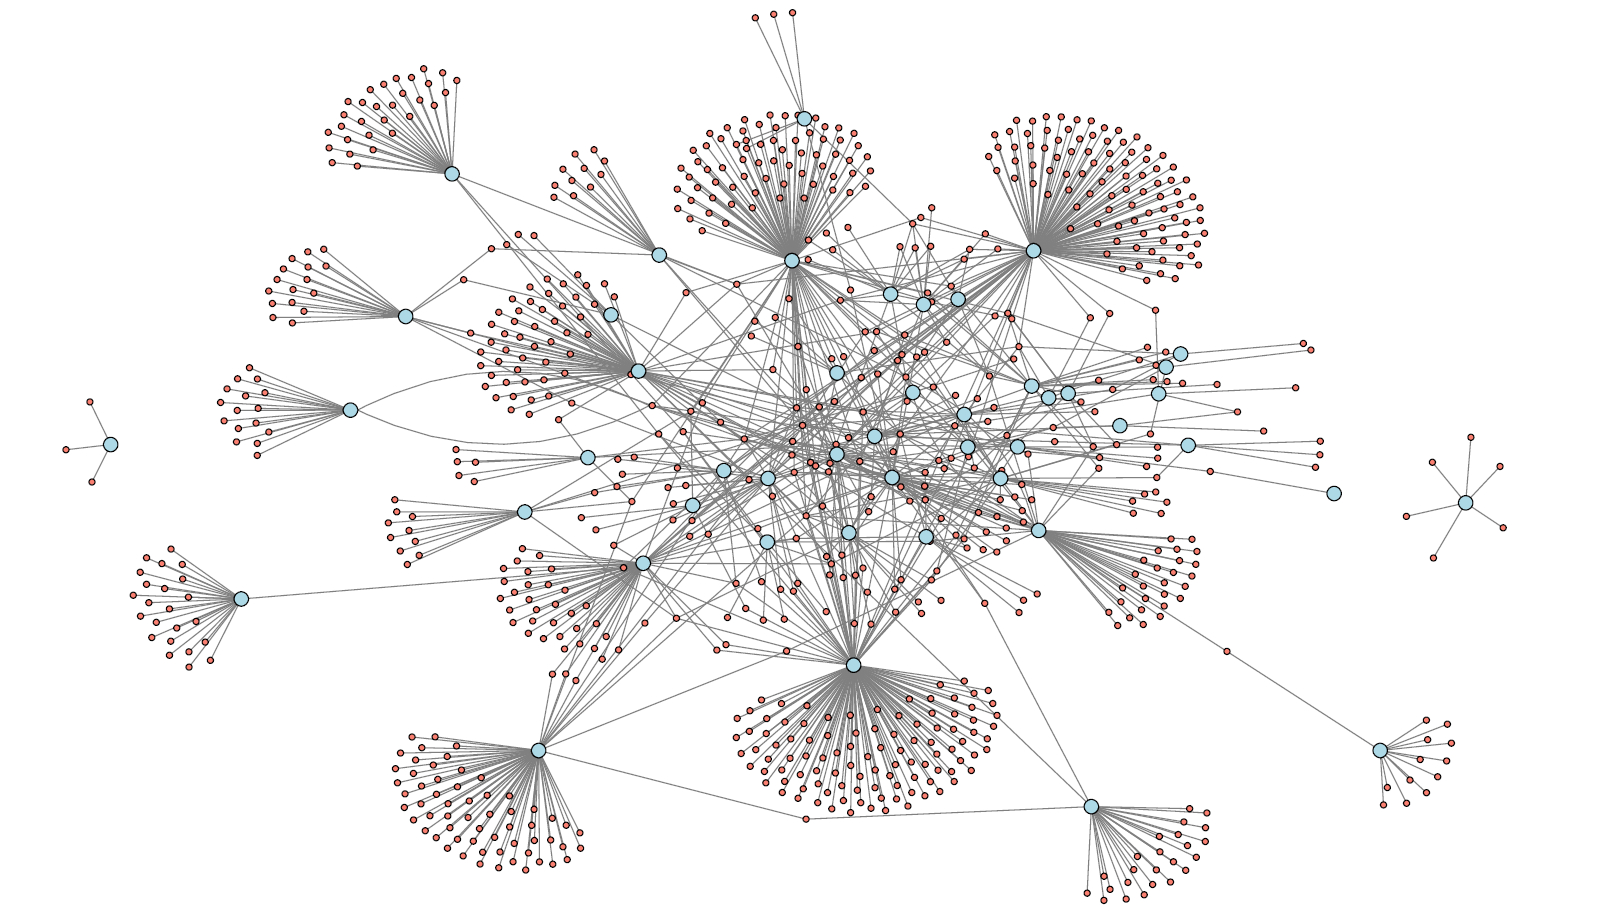
Another important aspect of the City of Chicago and Cook County network domain can be seen in the network map below. The blue circles are PONs, and the red circles are organizations. The lines represent when an organization is a member of a PON.
The network domain reflects a core-periphery style, or almost like the hub and spokes of a wheel. The core organizations and PONs are highly embedded, or interconnected, within the domain. As we continue to collect data, we aim to uncover if that embeddedness comes with both costs and benefits.
Networks
Network Descriptive Statistics
Non-Profit Status (NPO): About 24% of the networks are non-profit organizations.
Government Mandate: Approximately 36% are government-mandated.
The data also shows various forms of motivation, such as government funding opportunities (38%), funded policy mandates (22%), unfunded policy mandates (11%), philanthropic opportunities (8%), and grassroots efforts (30%).
Funding Sources:
Federal Grants: Received by 29% of networks.
State Grants: Received by 42%.
City Grants: Received by 31%.
Public Donations: Received by 26%.
Fundraisers: Used by 23%.
National Foundations: Funding received by 30%.
State or Local Foundations: Received by 45%.
Fee for Service: Utilized by 22%.
Activities:
Developing protocols: Engaged in by 29% of networks.
Coordinating events: 47%.
Community needs-assessment: 24%.
Administering programs: 47%.
Policy change initiatives: 38%.
In the diverse landscape of public health networks within the metropolitan Chicago area, a detailed examination of their composition and operational characteristics reveals insightful patterns. These networks, primarily comprising member organizations, exhibit a variety of structural and funding attributes that shape their functioning and impact.
Mission Statements
We parsed the mission statements of health networks for frequently used phrases. We were able to group our findings into five main categories: Goals, Activities, Partners, Target Populations and Lenses. (The final category, Lenses, emerged from the Goals category to refer to concepts that were mentioned frequently but were not deliverables.)
“Goals” refer to the conditions or metrics that the networks were stated to be in service of. Examples include Computer Literacy, Job Help, Leadership, Lifestyles (meaning “healthy” or active lifestyles, in this context), and Nutrition.
“Activities” are the means by which the networks pursued these goals, for example Education (of the public) and Research. “Activities” were mentioned infrequently in the mission statements.
“Partner” types were broken down into nine frequently mentioned categories: Academic (presumably university-based research centers or other related institutions, excluding actual schools), Community-Based Organizations, Caregivers (referring to individuals), Employers, Government, Healthcare Providers (institutions or companies, not individual caregivers), Partners, Schools, and Organizations (excluding those specifically referred to as “Community-Based”).
“Target Populations” could refer to geography (Chicago, Southern Illinois, specific neighborhoods, etc), age (babies, children, elderly), race (Black, Asian) or economic status (underserved).
Finally, “Lenses” emerged as separate from the “Goals” category of being a larger ideal such as health equity or justice that served to guide the organization while not necessarily being measurable.
Network Nature and Government Influence
A notable 24% of these networks operate under a non-profit status, highlighting a significant segment dedicated to public welfare without a profit motive. Concurrently, approximately 36% of these entities are government-mandated, indicating a substantial governmental role in public health initiatives within this region.
Diverse Motivations and Funding Mechanisms
The motivations driving these networks are multifaceted. Government funding opportunities are a major incentive for 38% of the networks, while 22% are spurred by funded policy mandates. Interestingly, 11% are motivated by unfunded policy mandates, reflecting a commitment to public health objectives without financial support from government. Additionally, 8% are driven by philanthropic opportunities, and a notable 30% emerge from grassroots efforts, underscoring the community’s active involvement in public health.
Varied Sources of Financial Support
Funding sources for these networks are diverse, ensuring a broad base of support. Federal grants are received by 29%, while a higher proportion, 42%, benefit from state grants. City grants support 31% of the networks, illustrating the layered governmental backing at different administrative levels. Public donations, contributing to 26% of the networks, and fundraisers, utilized by 23%, indicate significant community engagement and support. Moreover, 30% of the networks receive funding from national foundations, and an even greater 45% are supported by state or local foundations, highlighting the importance of philanthropic institutions in sustaining public health initiatives. Lastly, 22% of the networks employ a fee-for-service model, adding a self-sustaining financial dimension to their operations.
Scope of Activities
The activities of these networks are as varied as their funding sources. Developing protocols is a focus for 29%, which is crucial for standardizing/professionalizing public health practices. A significant 47% are coordinating events, indicating a strong emphasis on community engagement and awareness. Community needs assessment, undertaken by 24%, underscores the data-driven approach of these organizations. Administering programs, a key activity for another 47%, reflects the hands-on role these networks play in public health implementation. Lastly, 38% are involved in policy change initiatives, highlighting their active role in shaping public health policy landscapes.
This overview of the public health networks in the metro Chicago area reveals a complex and dynamic environment where diverse organizations operate with varied motivations and resources, collectively contributing to the region’s public health landscape.
Organizations
Distribution of member organizations by type
We analyzed the distribution of member organization types within these networks. The average number of member organizations across 54 networks is 20. Non-profit organizations emerge as the predominant players, constituting 65.14% (542 organizations) of the network. This significant presence underscores the critical role of non-profit entities in driving public health initiatives and providing essential services in the Chicago area.
Contrastingly, for-profit organizations, though smaller in proportion at 17.43% (145 organizations), still represent a vital component of the network. Their involvement reflects the growing intersection between the public and the private sectors, highlighting a trend toward collaborative models that leverage the strengths of diverse organizational types.
Governmental organizations, accounting for 12.26% (102 organizations) of the network, are key to this landscape. Their role in policy-making, regulation, and funding is indispensable in shaping the overall direction and effectiveness of public health efforts.
Advocacy groups and specialized programs, though smaller in scale with 1.44% (12 organizations) and 2.40% (20 organizations) respectively, add a unique dimension to the network. Advocacy groups play a crucial role in raising awareness, influencing policy, and representing community voices, while specialized programs address specific health issues or populations often initiated by the federal government, often filling gaps in services and research.
Interestingly, networks themselves as other networks’ members, making up a modest 1.32% (11 networks), are not only instrumental in facilitating collaboration, information exchange, and resource sharing among the various organizations, but also the glue that holds the networks together, enabling more cohesive and coordinated public health efforts.
Public Health Networks Composition
As introduced in the previous sections, the diversity of member organizations in the public health networks of the metro Chicago area is a key aspect of their composition. However, the complete spectrum of organization types, including Government, Non-profit, Program, For-profit, Network, and Advocacy groups, is rarely represented within a single network.
A closer examination indicates that only two networks, the “Collaborative for Community Wellness” and “School Health Access Collaborative”, exhibit a comprehensive mix of all these organization types. This suggests that while diversity in organizational makeup is a common feature, the extent of this diversity varies considerably across different networks. The most common composition type typically involves a combination of non-profits and one or two other organization types, underlining the central role that non-profits play in these health networks.